S&P 500 Surpasses 7,800, Achieving Record $70.8 Trillion Valuation

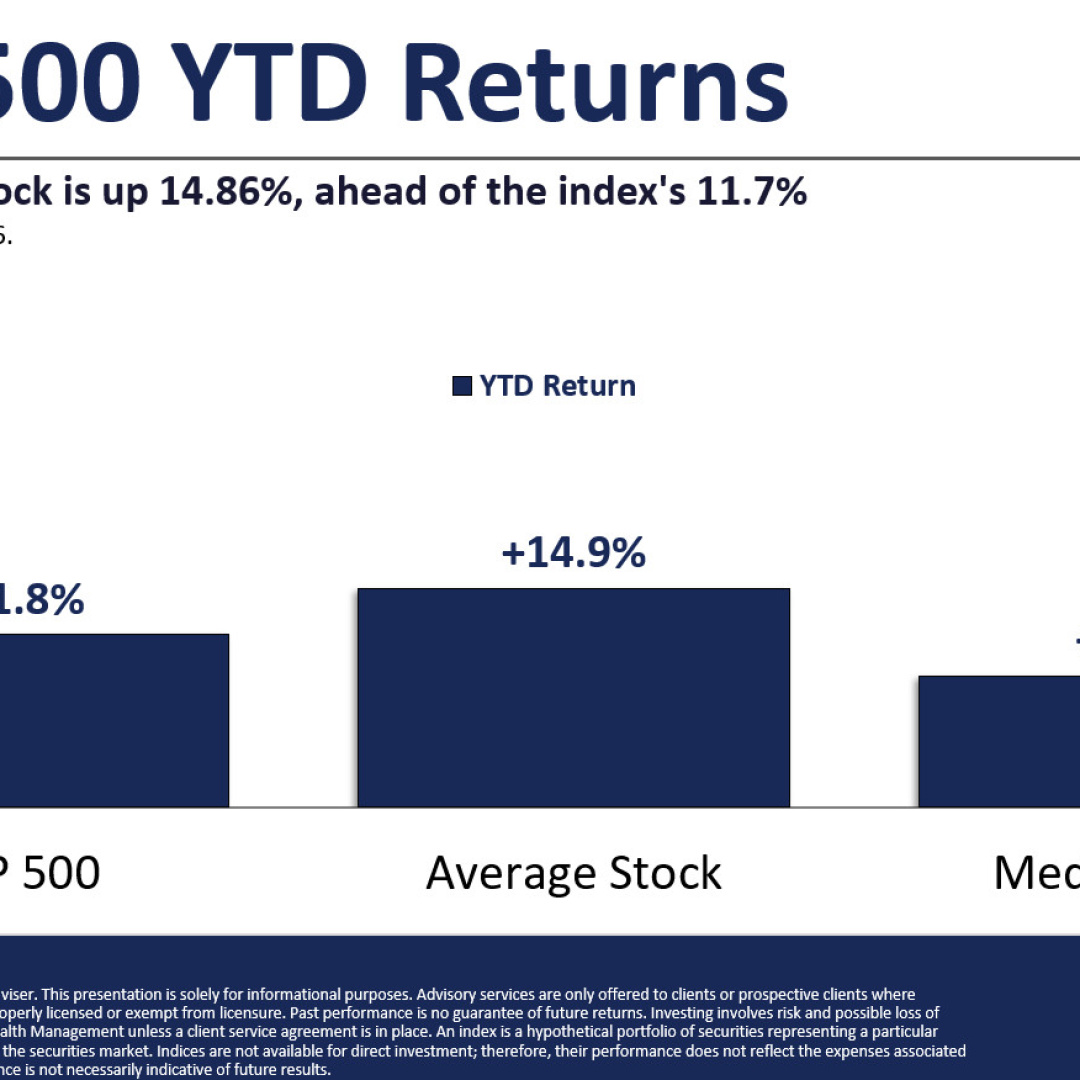
The S&P 500 has reached a significant milestone, surpassing the 7,800 mark for the first time and pushing its total market capitalization to a record $70.8 trillion. This valuation is comparable to the combined GDP of the United States, China, and Japan, represented by a diverse group of 500 companies. This achievement marks a remarkable recovery for the index, which was trading below 6,400 earlier in 2026, indicating a rally of over 20% from that low point.
Wall Street analysts had previously set the 7,800 target as an optimistic year-end goal, with firms like J.P. Morgan and Morgan Stanley predicting this level as achievable. The index reached this target months ahead of schedule, closing at 7,723.55 on August 5, with an intraday high of 7,793.68 shortly thereafter.
For Your Trading Desk
Sponsor Spike Success.
The S&P 500 first crossed the 7,000 threshold in January 2026, and the climb to 7,800 in approximately seven months represents an 11.4% gain during a period of uncertainty among investors regarding the sustainability of the rally. Two primary factors have driven this upward trend: robust corporate earnings and increased spending in artificial intelligence. The AI sector, which began influencing equity valuations in 2023, continues to attract significant capital.
Earnings growth has expanded beyond the few mega-cap technology companies that previously dominated market gains, with analysts expecting broader participation from more constituents within the index. However, the rising valuations come with increased risk. Some analysts estimate the index is trading at over 42 times earnings, a level that raises concerns even among bullish strategists. Historically, the long-term average price-to-earnings ratio for the S&P 500 has hovered around the mid-teens to low twenties.
These elevated valuations create a risk profile that could lead to sharp declines if earnings fail to meet expectations or if macroeconomic conditions worsen. Analysts have suggested a potential year-end range for the index between 7,800 and 8,100, indicating that the current levels may not represent a peak but rather a waypoint in the ongoing market journey.